Table of contentsSales Win Rate Statistics at a Glance
Win rate is the most quoted and least comparable number in sales. One team counts every opportunity in the CRM, another counts only deals that reached the proposal stage, and both call the result their win rate. The sales win rate statistics in this guide are benchmarks you can trust, but only once you know what each one measures.
We have pulled together the most reliable recent data: Ebsta’s analysis of $48 billion in B2B pipeline, its study of more than 655,000 qualified and unqualified opportunities, Proposify’s benchmark of 742,137 proposals, plus Gartner and 6sense research on why buyers choose one vendor over another. Each section ends with what the number means for your team.
Use these B2B win rate benchmarks to set realistic targets, spot where deals leak and decide where to focus. Teams that pair benchmarks with document analytics and engagement tracking see the leak as it happens, not at the end of the quarter.
Sales Win Rate Statistics at a Glance
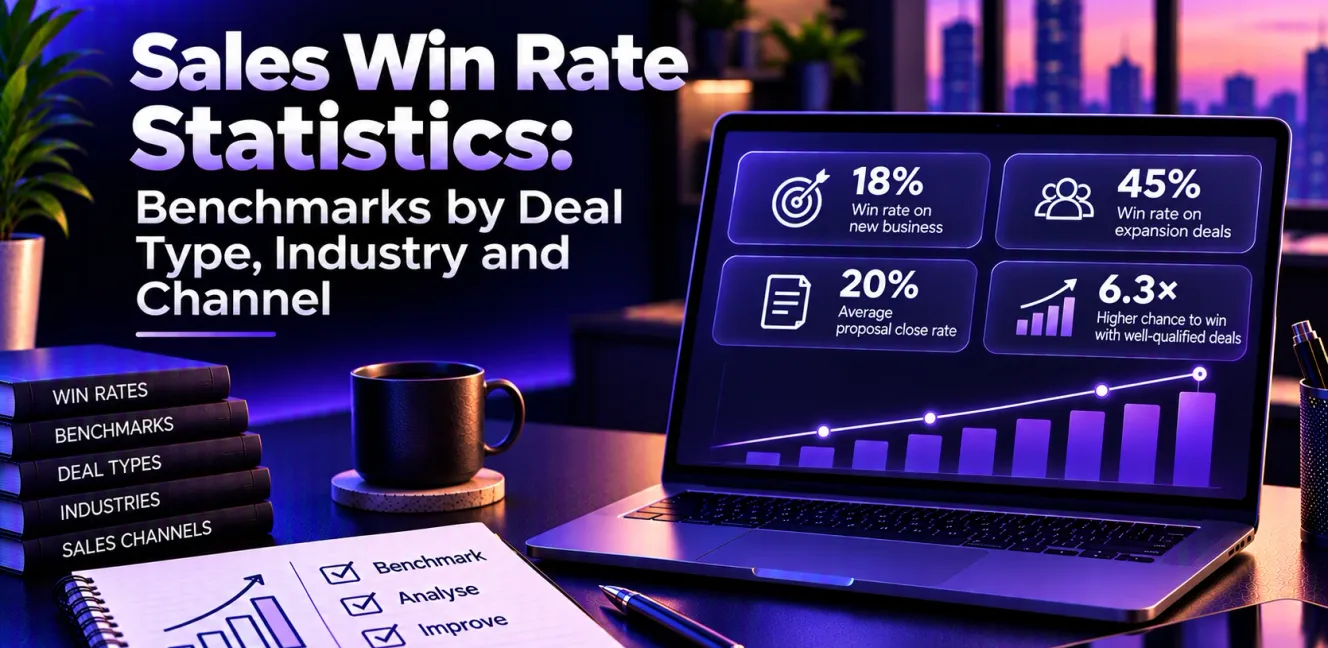
- 18% average win rate on new business (Ebsta, 2025).
- 45% average win rate on expansion deals with existing customers (Ebsta, 2025).
- 20% industry average proposal close rate, from Proposify’s benchmark of 742,137 proposals.
- 50% win rate for highly qualified deals, against 8% for poorly qualified ones (Ebsta, 2025).
- 10% fall in win rates in the most recent benchmark year, after an 18% fall the year before (Ebsta, 2025).
- 77% of the time, buyers purchase from the vendor they favoured before first contact (6sense, 2025).
- 2.5x more likely to report a high-quality deal when the buying group reaches consensus (Gartner, 2025).
How to Measure Win Rate Before You Benchmark It
The simplest formula is deals won divided by deals closed (won plus lost), over the same period. Open deals stay out of the calculation until they resolve.
The bigger decision is where you start counting. Three common versions give very different answers:
- Opportunity win rate: won deals divided by all qualified opportunities. This is closest to the benchmarks below.
- Proposal close rate: won deals divided by proposals sent. This runs higher because weak opportunities drop out before the proposal.
- RFP win rate: won bids divided by bids submitted. This tracks formal tenders only.
Pick one, write down the definition and stick with it. A win rate that changes definition each quarter cannot tell you whether anything improved.
Average Win Rate Benchmarks for B2B Teams
These B2B win rate benchmarks give you the baseline. They come from different datasets, so compare like with like.
The Average Win Rate on New Business Is 18%
Ebsta’s 2025 GTM Benchmarks, built on $48 billion of opportunities from UK and US technology companies, found an average win rate of 18% on new deals.
Roughly one in five new opportunities becomes a customer. If your team wins one in ten, the gap is worth investigating. If you win one in three, check whether your definition of an opportunity is stricter than most.
The Average Proposal Close Rate Is 20%
Proposify’s State of Proposals 2026, a benchmark of 742,137 proposals, put the industry average proposal close rate at 20%. Teams using the dedicated proposal platform in that study averaged 34%.
The proposal close rate sits above the opportunity win rate because only better-qualified deals reach the proposal stage. The jump from 20% to 34% also shows how much a disciplined proposal process is worth on its own.
RFP Win Rates Run Higher Again
Formal bids follow their own pattern, with average RFP win rates around 45% in industry surveys. Our roundup of RFP statistics covers bid volumes, response times and win rates for proposal teams.
Win Rates Fell 18%, Then Another 10%
Ebsta’s data shows win rates fell 18% in 2023, driven by sales cycles that ran 16% longer and deal values that dropped 21%. In 2024, win rates fell a further 10%, even as cycles shortened by 9% and deal values rose 54%.
Fewer deals are closing, but the ones that do are larger. That pushes more weight onto each proposal, because each lost deal costs more.
78% of Sellers Missed Quota
78% of sellers missed quota in Ebsta’s most recent benchmark year, up from 69% the year before. The gap between bottom and top sellers in how quickly they generate revenue widened from 8.9 times to 11 times.
When most of a team misses target, the cause is usually systemic: weak qualification, slow turnaround or too much time on admin.
Win Rate by Deal Type: New Business vs Expansion
The single biggest swing in win rate comes from who you are selling to.
Expansion Deals Win 45% of the Time
Ebsta found a 45% win rate on customer expansion, against 18% on new business. Existing customers already trust you, have seen results and know who to call.
Expansion Deals Close in 52 Days, Not 91
Expansion deals closed in 52 days on average, against 91 days for new business (Ebsta, 2025). They also involved five decision-makers instead of eight.
52% of New Revenue Came From Existing Accounts
In 2024, 52% of new revenue came from existing accounts (Ebsta, 2025). Sustained customer engagement boosted expansion opportunities by 189%.
What this means: a renewal or upsell proposal is not paperwork. It is the highest-probability deal your team will work all quarter. An account extension and renewal proposal template makes the expansion conversation repeatable.
Between renewals, a strategic QBR presentation template keeps the engagement going.
Turn your best accounts into your best pipeline. Start free and build your next renewal proposal from your existing content in minutes.
Win Rate by Industry
Win rate by industry varies more than most leaders expect. These figures come from Proposify’s 742,137-proposal benchmark, so they measure proposal close rates rather than full-funnel win rates.
The Highest-Closing Industries
- Non-profit: 53%
- Telecommunications: 51%
- Digital marketing: 48%
- Accounting: 47%
The Lowest-Closing Industries
- Construction: 21%
- Hotel and venue: 14%
Why Industry Benchmarks Vary So Much
Industries with high close rates tend to have repeat buyers, defined service packages and shorter decision chains. Low close rates usually reflect competitive tendering, where buyers collect several quotes by default and price weighs heavily.
Check your win rate by industry first, before any blended average. For SaaS teams, our page on proposal software built for SaaS teams shows how faster turnaround supports win rates in a crowded market.
Win Rate by Channel
Not all pipeline is equal. Ebsta scored each lead source on channel efficiency, calculated as win rate multiplied by average contract value, divided by sales cycle length.
Partner Referrals Lead at 1.3x
Partner referrals scored 1.3x, the highest of any channel (Ebsta, 2025).
Organic Inbound Follows at 1.2x
Organic inbound scored 1.2x, and outbound scored 1.05x (Ebsta, 2025).
Events and Paid Trail Behind
Events scored 0.78x and paid channels 0.68x (Ebsta, 2025).
Warm channels produce buyers who already believe you can help. Cold channels require more proof, so the documents you send to those buyers need stronger evidence: case studies, specific outcomes and clear pricing.
What Moves Win Rates Up
Benchmarks tell you where you are. These figures show what moves the number.
Qualification Is Worth 6.3 Times More Wins
Ebsta’s 2025 Sales Qualification Report found that well-qualified deals were 6.3 times more likely to close and closed 21.6% faster. Highly qualified deals won 50% of the time, while poorly qualified deals won 8%.
Every unqualified proposal drags your win rate down and burns hours your team needs for real buyers. A structured framework helps. Our guide to the Miller Heiman Blue Sheet shows one proven way to map a complex deal before you commit to a proposal.
The Preferred Vendor Wins 77% of the Time
6sense’s 2025 Buyer Experience Report, based on more than 4,000 buyers, found that 94% of buying groups ranked preferred vendors before first contact and bought from that favourite 77% of the time.
Your win rate is partly decided before your first call. Content that buyers find and share on their own, including documents your champion forwards internally, shapes that early ranking.
Consensus Makes High-Quality Deals 2.5 Times More Likely
Gartner found that buying groups that reach consensus are 2.5 times more likely to report a high-quality deal. When buyers experience content relevant to the whole buying group, they are three times more likely to report a high-quality deal.
More Than One Reader Lifts Close Rates by 20%
In Proposify’s 742,137-proposal benchmark, close rates rose 20% when more than one stakeholder viewed the proposal. Proposals that reach the wider buying group win more often.
Sellers Who Partner With AI Hit Quota 3.7 Times More Often
Gartner’s 2024 survey of 1,026 sellers found that those who partner effectively with AI tools are 3.7 times more likely to meet quota. Faster research and drafting free sellers to spend more time on qualification and consensus building, the two levers above.
Teams that want a broader view of performance than win rate alone can use a sales scorecard to track activity, pipeline and outcomes together.
How to Benchmark Your Own Win Rate
Turn these B2B win rate benchmarks into a target that fits your team:
- Fix your definition and calculate win rate over at least two quarters.
- Split new business and expansion. Blending them hides both numbers.
- Split by channel, so referral wins do not mask weak outbound.
- Compare your win rate by industry, not against a generic average.
- Track how many proposals reach more than one stakeholder.
- Review lost deals for qualification gaps before blaming price.
Sales teams can run this inside one workspace with proposal software built for sales teams, where every proposal, quote and contract sits in organised folders and every link shows who opened it.
Stop guessing why deals go quiet. Send your next proposal as a trackable link and see exactly when it was opened and how far it was read.
The Final Word on Sales Win Rate Statistics
The sales win rate statistics for 2026 set a sobering baseline. New business wins about 18% of the time, win rates have fallen two years running and most sellers are missing quota. Yet the same data shows exactly where to push: qualify harder, sell more to existing customers, lean on warm channels and write for the whole buying group.
The teams that win more are rarely the ones who write longer proposals. They are the ones who send fewer, better-targeted proposals faster, and who know when each one is being read. Our guide to pre-sales proposal strategies covers the groundwork that makes those proposals worth sending.
A strong sales proposal template built around the buying group’s shared goal is the simplest place to start.
Frequently Asked Questions
What is a good sales win rate?
Among B2B win rate benchmarks, Ebsta’s puts the average win rate on new business at 18%, and expansion deals average 45%. Highly qualified deals win around 50% of the time. A good win rate depends on your definition, deal type and industry, so compare like with like.
What is the difference between win rate and close rate?
Win rate usually measures won deals against all qualified opportunities. Close rate often measures won deals against proposals sent. Because weak opportunities drop out before the proposal stage, close rates tend to run higher: Proposify’s proposal benchmark puts the industry average at 20%.
Which industries have the highest win rates?
In Proposify’s benchmark of 742,137 proposals, non-profit proposals closed at 53%, telecommunications at 51%, digital marketing at 48% and accounting at 47%. Construction closed at 21% and hotel and venue proposals at 14%.
Why are B2B win rates falling?
Ebsta’s data shows win rates fell 18% in 2023 and 10% in 2024. Larger buying groups, more internal conflict and buyers choosing a favourite before talking to sales all play a part. Deals are also getting bigger, which adds stakeholders and scrutiny.
What do sales win rate statistics say about improving results?
Sales win rate statistics point to qualification as the biggest lever: well-qualified deals are 6.3 times more likely to close. Selling to existing customers, prioritising referral and inbound channels, and writing proposals for the whole buying group also lift results.