
Table of Contents
B2B Sales Statistics 2026: 30 Data Points on How Buyers Decide and Deals Close
Most sales numbers that circulate online are recycled, undated or impossible to trace. The 30 B2B sales statistics in this guide are not. Every figure comes from research published in 2024, 2025 or 2026 by Gartner, Forrester, 6sense, Ebsta or Atradius, and every one links to the original source so you can check it before you quote it in a deck or a board update.
The numbers are grouped by the stage of the deal they affect: how buyers research, how buying groups agree, how long deals take, what winning looks like, where AI fits and how quickly the money arrives. Under each group, you will find what the data means for the proposals, quotes, decks and statements of work your team sends.
That last part matters. Buyers now make most of their decision away from your sales team, which means the documents you send do much of the selling for you. If your team still builds those documents by hand, AI-powered document generation is the fastest way to close that gap.
B2B Sales Statistics at a Glance
Short on time? These ten B2B buyer statistics and deal benchmarks tell most of the story.
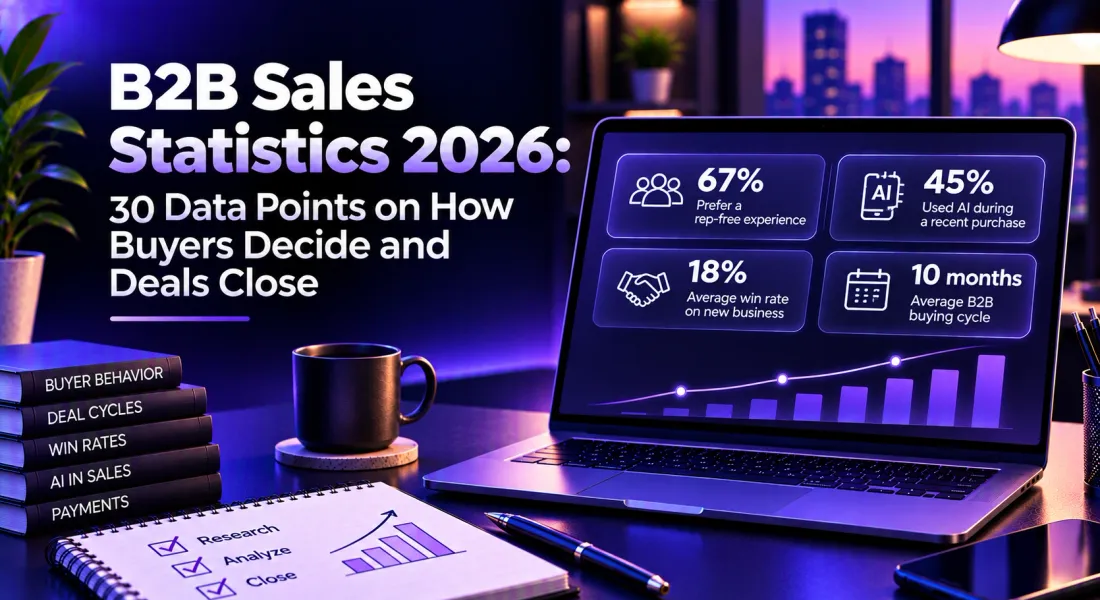
- 67% of B2B buyers prefer a rep-free buying experience (Gartner, 2026).
- 69% of B2B buyers still turn to sales reps to validate what AI told them (Gartner, 2026).
- 94% of buying groups rank their preferred vendors before first contact (6sense, 2025).
- 13 internal stakeholders and 9 external influencers shape a typical purchase (Forrester, 2026).
- 74% of buyer teams show unhealthy conflict during the decision (Gartner, 2025).
- 10 months is the average B2B buying cycle, down from about 11 (6sense, 2025).
- 18% is the average win rate on new business, against 45% on expansion deals (Ebsta, 2025).
- 78% of sellers missed quota in the most recent benchmark year (Ebsta, 2025).
- 4.8 hours a week is what AI saves the average seller (Gartner, 2026).
- 7 in 10 North American companies deal with late B2B payments (Atradius, 2026).
How B2B Buyers Research Before They Talk to Sales
The first set of B2B buyer statistics confirms what most sellers already feel: the buyer is further along than you think by the time they reply.
1. 67% of B2B Buyers Prefer a Rep-Free Experience
A Gartner survey of 646 B2B buyers, run in August and September 2025, found that 67% would rather buy without a sales rep involved. A separate cut of the same research found that 70% prefer a completely digital, self-service buying experience.
What it means: your documents have to work without you in the room. A proposal that only makes sense after a walkthrough call will stall when the buyer forwards it to a colleague you have never met.
2. 45% of Buyers Used AI During a Recent Purchase
In the same Gartner study, 45% of buyers said they used AI during a recent purchase, mostly to gather information on vendors and products.
What it means: buyers are summarising your website, your case studies and your pricing page with AI before they read your proposal. Consistency between your site and your documents is no longer a nice touch. It is how you avoid contradicting yourself.
3. Buyers Use an Average of Seven Information Sources
Gartner’s May 2026 release reported that buyers used an average of seven information sources during a recent purchase.
What it means: your proposal is one input among seven. It needs to be the clearest one, with the outcome, the price and the next step visible in the first two pages.
4. 69% Still Validate AI Insights With a Sales Rep
Here is the counterweight. 69% of B2B buyers prefer to validate AI-generated insights with sales reps (Gartner, 2026). Trust in both channels is split: 51% say they are more likely to encounter misleading information from GenAI, while 49% say the same about a sales rep.
What it means: buyers come to you to confirm, not to discover. The rep’s job, and the job of the documents the rep sends, is to remove doubt with specifics: named outcomes, real numbers and a clear scope.
5. 94% of Buying Groups Rank Vendors Before First Contact
6sense’s 2025 Buyer Experience Report, based on more than 4,000 buyers across North America, EMEA and APAC, found that 94% of buying groups had ranked their preferred vendors before first contact. They bought from that early favourite 77% of the time.
What it means: of all the B2B buyer statistics here, this one matters most. Most deals are won or lost before your first call. The content buyers find on their own, including any document a champion shares internally, decides whether you make the shortlist.
6. The Research Split Moved From 70/30 to 60/40
The same report found that the balance between independent research and seller engagement shifted from 70/30 to 60/40 (6sense, 2025). Buyers still averaged 16 interactions per person with the winning vendor, unchanged from the year before.
What it means: buyers are inviting sellers in a little earlier, but they still expect every one of those 16 touchpoints to be useful. A same-day follow-up document beats a polished one that arrives next week.
Want every document your team sends to sound like your website, not a rushed draft? Start building branded documents free and generate your first one from a single prompt.
B2B Buying Statistics on Buying Groups and Consensus
Your champion is not your buyer. These B2B buying statistics show how many people now sign off on a purchase, and how often they disagree.
7. A Typical Decision Involves 13 Stakeholders and 9 Influencers
Forrester’s State of Business Buying 2026 found that the typical buying decision includes 13 internal stakeholders and nine external influencers, with the number rising for complex purchases. Of buyers in groups of six or more, 94% said the larger group brought clear benefits.
What it means: write for the reader you will never meet. Finance, procurement and IT will each skim your proposal for different reasons, so give each one a section they can find in seconds.
8. 74% of Buyer Teams Show Unhealthy Conflict
Gartner’s survey of 632 buyers, run in August and September 2024, found that 74% of buyer teams demonstrate unhealthy conflict during the decision. Buying groups ranged from five to 16 people across as many as four functions.
What it means: your document is often the only shared reference point the buying group has. If it frames the problem the same way for everyone, it reduces the arguments that stall deals.
9. Consensus Makes a High-Quality Deal 2.5 Times More Likely
Buying groups that reach consensus are 2.5 times more likely to report that their deal was high quality, according to the same Gartner research.
What it means: as the B2B buying statistics in this section show, helping buyers agree with each other is part of the sale. A one-page summary that states the shared goal before the detail does more than another feature list.
10. Group-Level Tailoring Lifts Consensus by 20%
Gartner found that content tailored to the buying group’s shared priorities improves consensus by 20%. Content tailored to individual members did the opposite, with a 59% negative impact on consensus.
What it means: stop writing a separate pitch for every stakeholder. Write one document built around the organisation’s goal, then add short role-specific sections underneath it.
11. Procurement Is a Decision-Maker in 53% of Buying Cycles
Forrester reports that procurement professionals are decision-makers in 53% of business buying cycles, and engage from the start of the process.
What it means: your pricing section will be read by someone whose job is to push back on it. Clear line items and a stated scope give procurement less to question.
12. More Than 60% of Buyers Now Use a Trial
More than 60% of business buyers use a trial to evaluate solutions, rising to 78% for purchases of $10 million or more, according to Forrester.
What it means: if a trial or pilot is part of your sale, document its success criteria up front. A short pilot agreement with agreed measures turns a trial into a signed contract faster.
Sales teams running multi-stakeholder deals can see how proposal software built for sales teams handles this, with one shared document that every stakeholder can open from a single link.
How Long B2B Deals Take in 2026
Time is the cost nobody budgets for. This B2B sales data shows where cycles are heading and what slows them.
13. The Average Buying Cycle Is Now 10 Months
6sense found that average buying cycles shortened from about 11 months in 2024 to 10 months in 2025.
What it means: a 10-month journey with a 60/40 research split leaves your team a narrow window to influence the outcome. The documents you send inside that window need to be fast and right first time.
14. 49% of Buyers Say Financial Pressure Shortened Their Cycle
Economic pressure is compressing timelines. 49% of buyers said financial pressure shortened their buying cycles, and 62% engaged sellers earlier as a result (6sense, 2025).
What it means: when buyers move early, the seller who can send a credible proposal the same day wins the conversation. Speed of response is a competitive advantage in its own right.
15. New Business Takes 91 Days to Close, Expansion Takes 52
Ebsta’s 2025 GTM Benchmarks, built on $48 billion of pipeline from UK and US tech companies, put the average new-business sales cycle at 91 days, against 52 days for expansion deals. Expansion deals also involved five decision-makers instead of eight.
What it means: existing customers buy faster because trust is already in place. Renewal proposals and upsell documents deserve the same care as new-business proposals, because they close in roughly half the time.
16. Deal Slippage Fell From 44% to 36%
In 2023, 44% of deals slipped past their expected close date. In 2024, that fell to 36% as cycles shortened by 9%, according to Ebsta.
What it means: more than a third of deals still slip. Many slip at the paperwork stage, waiting for a revised quote, a redlined contract or a signature. Shortening that stage is the easiest win available.
If your deals regularly stall after the proposal goes out, our guide to shortening the B2B sales cycle walks through the fixes stage by stage.
B2B Sales Statistics on Win Rates and Quota
Winning is harder than it was two years ago. These figures set a realistic benchmark.
17. Win Rates Fell 10% in the Latest Benchmark Year
Ebsta reported that win rates fell 18% in 2023 and a further 10% in 2024. Deal values recovered, rising 54% in 2024.
What it means: the B2B sales data shows fewer deals closing, but the ones that close are bigger. Bigger deals bring more stakeholders, which brings us back to documents that serve the whole buying group.
18. 78% of Sellers Missed Quota
78% of sellers missed their quota in Ebsta’s most recent benchmark year, up from 69% the year before.
What it means: if most of your team is missing target, the problem is rarely effort alone. It is usually time lost to admin, poor qualification or deals that should never have reached the proposal stage.
19. New Business Wins 18% of the Time, Expansion Wins 45%
Ebsta found an 18% average win rate on new business, compared with 45% on customer expansion. In 2024, 52% of new revenue came from existing accounts.
What it means: your current customers are your best pipeline. A structured account renewal and extension proposal turns that 45% into a repeatable motion rather than a happy accident.
20. Well-Qualified Deals Are 6.3 Times More Likely to Close
Ebsta’s 2025 Sales Qualification Report analysed more than 655,000 B2B opportunities. Well-qualified deals were 6.3 times more likely to close and closed 21.6% faster. Highly qualified deals won 50% of the time, against 8% for poorly qualified ones.
What it means: the most expensive proposal is the one written for a buyer who was never going to sign. Qualify first, then write.
21. Partner Referrals Are the Most Efficient Channel
Ebsta scored channel efficiency as win rate multiplied by contract value, divided by sales cycle length. Partner referrals scored 1.3x, organic inbound 1.2x, outbound 1.05x, events 0.78x and paid channels 0.68x.
What it means: referred and inbound buyers arrive warmer, so the first document they receive should match that warmth. Lead with their context, not your company history.
B2B Sales Data on AI and Seller Productivity
AI is now part of both sides of the deal. These numbers show what it delivers and where it falls short.
22. AI Saves Sellers 4.8 Hours a Week
A Gartner survey of 210 sales leaders, run in January and February 2026, found that AI saves sellers an average of 4.8 hours per week.
What it means: that is more than half a working day back every week, provided the time goes into selling. For most teams, document creation is the obvious place to claim it.
23. 72% of Sales Organisations Fail to Reinvest the Time
The same research found that 72% of sales organisations report low reinvestment of AI time savings into high-value sales activities (Gartner, 2026). Those that do reinvest are 2.2 times more likely to exceed customer growth goals.
What it means: saving time is only half the job. Decide in advance where the reclaimed hours go, such as more discovery calls or faster proposal turnaround.
24. Sellers Who Partner With AI Are 3.7 Times More Likely to Meet Quota
Gartner’s 2024 survey of 1,026 B2B sellers found that those who effectively partner with AI tools are 3.7 times more likely to meet quota than those who do not.
What it means: the gap is not access to AI. It is how well AI is built into the daily workflow, including how quickly a seller turns a call into a first draft.
25. AI-Enabled Next Best Actions Lift Growth 2.6 Times
Sales organisations that give sellers AI-enabled next best actions are 2.6 times more likely to achieve commercial growth, according to a Gartner survey of 227 chief sales officers published in May 2026.
What it means: AI earns its keep when it tells a seller what to do next and helps them do it. Generating the follow-up document is one of the most direct examples.
26. 89% of Purchases Now Include AI Features
6sense found that 89% of purchases included AI features, and 58% of buyers engaged sellers earlier to clarify missing AI details.
What it means: if your product or service uses AI, explain how in plain language inside the proposal. Buyers are asking, and vague answers push you off the shortlist.
27. Buyers Rate Reps Above AI on Understanding Their Needs
Gartner’s buyer research found buyers were 39 percentage points more likely to say a rep understood their needs than GenAI, and 32 points more likely to say a rep made them confident in the decision.
What it means: use AI to produce the draft and keep the human for the judgement. The best documents pair machine speed with a seller’s read of what this buyer cares about.
Getting Paid: The Last Stage of the B2B Sale
A signed deal is not revenue until the invoice is paid. These two figures show why the final stage deserves attention.
28. Late Payment Affects 7 in 10 North American Companies
Atradius’ 2026 Payment Practices Barometer for North America, a survey of more than 600 businesses in the US, Canada and Mexico, found that late payment affects seven in ten companies.
What it means: closing the deal is only half the finish line. Agreeing payment terms inside the signed document removes one excuse for delay.
29. Overdue Invoices Make Up 23% of B2B Receivables
The same survey found that overdue invoices account for an average of 23% of B2B receivables in North America, although most are settled within a month of the due date (Atradius North America, 2026).
What it means: almost a quarter of what you are owed is late at any given time. Collecting a deposit at the point of signing shrinks that number before it starts.
30. Two Thirds of UK Businesses Report Delayed B2B Payments
Atradius’ 2026 survey of 210 UK businesses found that around two thirds report delayed payments from B2B customers, with customer cash flow problems cited by 51%.
What it means: late payment is not a US problem or a UK problem. It is a B2B problem, and clear payment terms in the original document are the cheapest fix.
Close the deal and get paid in the same window. Create your first document free and add e-signatures and payment collection to it in minutes.
How to Use These B2B Sales Statistics
Statistics are only useful if they change what your team does on Monday morning. Three changes follow directly from the B2B buyer statistics and B2B sales data above.
First, write for the buying group, not the champion. With 13 stakeholders and a 74% chance of internal conflict, your proposal needs a shared summary at the top and short sections for finance, procurement and the end user underneath. One document, shared from one link, beats five tailored attachments.
Second, compress the time between conversation and document. Buyers are moving earlier and faster, and deals still slip at the paperwork stage. A first draft the same day as the call keeps momentum. Proposal.biz generates a branded document from a URL and a prompt, so the draft exists before the buyer has finished their next meeting.
Third, watch what buyers do with the document. Knowing when a proposal was opened and how far the reader scrolled tells you which follow-up to send. Document analytics and engagement tracking turns silence after sending into a signal you can act on.
Ready-made starting points help too:
- A B2B sales pitch presentation template for the early conversation.
- A sales proposal template for the offer itself.
- A B2B sales contract agreement template to carry the deal over the line.
The Final Word on B2B Sales Statistics
The B2B sales statistics for 2026 point in one direction. Buyers research alone, decide in groups, validate with reps and expect every touchpoint to earn its place. Win rates are down, quota attainment is down and deals still slip at the final stages.
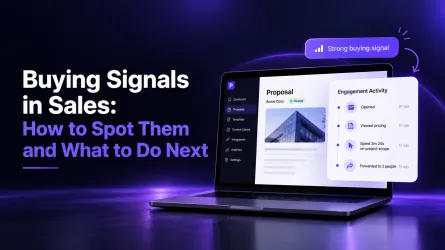
The teams pulling ahead are the ones whose documents keep pace with the buyer: written for the whole group, sent the same day and easy to sign and pay. Once a document is out, our guide to buying signals in sales shows which reactions to watch.
For the bigger picture beyond 2026, our sales trends for 2027 roundup shows where these numbers are heading.
Price is where buying groups argue most. Our piece on value-based selling in proposals shows how to frame it for a sceptical committee.
Proposal.biz brings the whole cycle into one window: draft from your URL, collaborate live, send a trackable link, collect the signature and take payment.
Frequently Asked Questions
What are the most important B2B sales statistics for 2026?
The headline figures are that 67% of B2B buyers prefer a rep-free experience, 94% of buying groups rank vendors before first contact, the average buying cycle is about 10 months and new-business win rates average around 18%. Together they show that buyers decide early and independently, so the content they find and share carries more weight than ever.
How many people are involved in a B2B purchase?
Forrester’s 2026 research puts the typical buying decision at 13 internal stakeholders plus nine external influencers. Gartner’s buying group research describes groups of five to 16 people across up to four functions. Either way, the B2B buying statistics point to one conclusion: your proposal will be read by people you never speak to.
What is a good B2B win rate?
Ebsta’s benchmark data shows an average win rate of 18% on new business and 45% on expansion deals. Well-qualified opportunities win around 50% of the time, against 8% for poorly qualified ones, so qualification has a bigger effect on win rate than almost any other factor.
How long does a B2B sale take?
6sense measured an average buying cycle of about 10 months in 2025 from the buyer’s side. Measured from the seller’s side, Ebsta found new-business deals take around 91 days from opportunity creation to close, while expansion deals take around 52 days.
Where do these B2B sales statistics come from?
Every figure in this article comes from published research by Gartner, Forrester, 6sense, Ebsta or Atradius, dated between 2024 and 2026. Each statistic links to its original source in the body of the article so you can verify it before using it.

Prabir Chaudhary
 Prabir Chaudhary
 Ronak Surti
 Dimple Maru