Table of contentsSales Proposal Statistics at a Glance
Ask ten sales leaders what makes a proposal win and you will get ten opinions. The sales proposal statistics in this guide replace opinion with evidence. The core dataset is Proposify’s State of Proposals 2026 report, a benchmark of 742,137 proposals worth just over $3 billion, sent across 30 industries in 2025. We have paired it with independent research from Gartner, Forrester, 6sense and Ebsta on how buying groups read, compare and approve what you send.
The result is a set of sales proposal benchmarks that show what a signed proposal looks like: how long it is, how fast it goes out, how buyers read proposals like it, how pricing is presented and what happens in the days after it lands.
One caution before the numbers. Most proposal benchmarks come from platform data, and platform data shows patterns, not proof. We flag where a figure is a correlation, so you can decide how much weight to give it. If you want to put the patterns into practice straight away, the fastest route is to create and send proposals from a single prompt and track what happens next.
Sales Proposal Statistics at a Glance
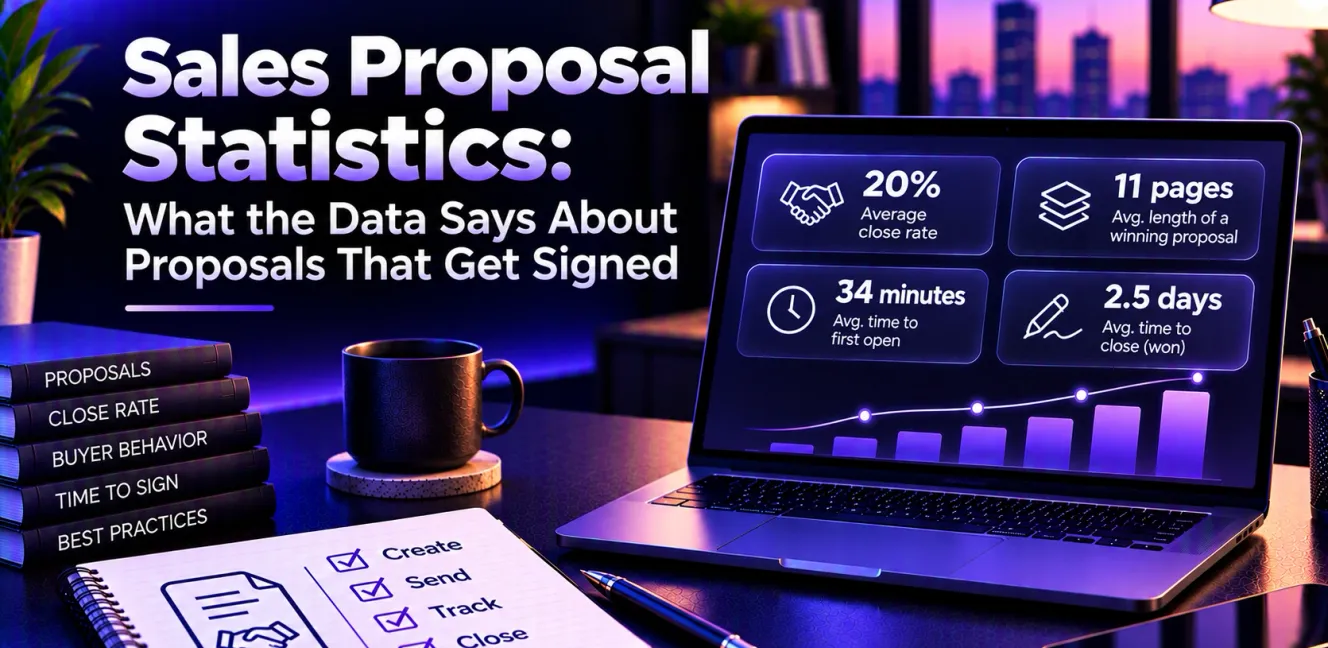
- 20% is the industry average proposal close rate cited in Proposify’s State of Proposals 2026.
- 11 pages is the average length of a winning proposal, against 13 for a losing one (Proposify, 2026).
- 34 minutes is the average time between sending a proposal and the prospect opening it (Proposify, 2026).
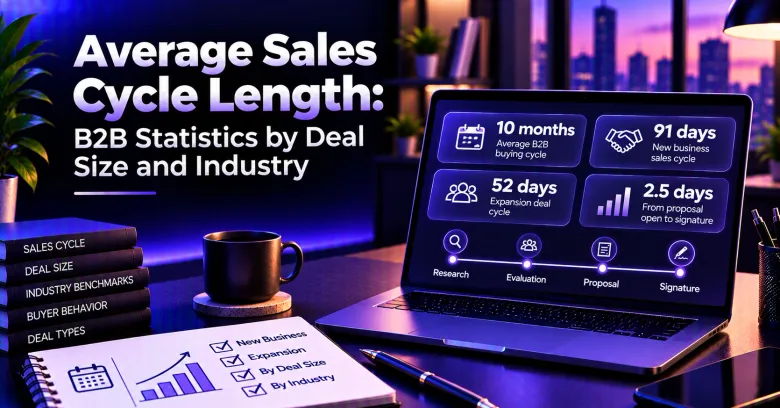
- 2.5 days is the average time from first open to closed-won (Proposify, 2026).
- 12 views for a winning proposal, against 8 for a losing one (Proposify, 2026).
- 20% higher close rate when more than one stakeholder views the proposal (Proposify, 2026).
- 7.72 minutes is the average time buyers spend on the pricing section (Proposify, 2026).
- 15% higher close rate, and 60% faster closing, for proposals that include e-signatures (Proposify, 2026).
- 35% faster close when the proposal goes out within 24 hours of a demo (Optifai, 2026).
- 6.3x more likely to close when the deal was well qualified before the proposal (Ebsta, 2025).
Proposal Close Rate Benchmarks
Your close rate is the number every other proposal metric feeds into. These benchmarks tell you where you stand.
The Industry Average Close Rate Is 20%
Proposify’s State of Proposals 2026 puts the industry average proposal close rate at 20%. Proposals sent through the platform it studied closed at 34% on average, which tells you how much room there is between an average process and a disciplined one.
Treat 20% as the floor, not the goal. Of all the sales proposal benchmarks in this guide, it is the one most worth tracking every month. If one in five proposals is signing, four in five are consuming hours of work for no return.
Close Rates Vary Widely by Industry
Industry changes the benchmark sharply. Non-profit proposals closed at 53%, telecommunications at 51%, digital marketing at 48% and accounting at 47% (Proposify, 2026). At the other end, construction closed at 21% and hotel and venue proposals at 14%.
Compare yourself to your own industry before you compare yourself to anyone else. A 30% close rate is strong in construction and weak in digital marketing.
Qualification Matters More Than Polish
Independent data backs this up. Ebsta’s 2025 Sales Qualification Report, covering more than 655,000 B2B opportunities, found that highly qualified deals won 50% of the time against 8% for poorly qualified ones. Well-qualified deals were 6.3 times more likely to close and closed 21.6% faster.
No amount of design fixes a proposal sent to a buyer who was never going to sign. Our guide to writing a sales proposal step by step starts with the discovery questions that decide whether a proposal is worth writing at all.
How Long Proposals Take to Create, Open and Sign
Speed shows up at every stage of the proposal, from the first draft to the final signature.
The Average Proposal Takes 17 Minutes to Create on a Proposal Platform
Proposify’s benchmark found an average creation time of 17 minutes for proposals built on a dedicated platform. That figure assumes templates and reusable content are already in place, which is exactly the point. Teams building every proposal from a blank document spend hours, not minutes.
Buyers Open Proposals Within 34 Minutes
On average, prospects opened a proposal 34 minutes after it was sent, twice as fast as the year before (Proposify, 2026).
Buyers are waiting for your proposal. A delay of days does not build anticipation. It hands the attention to whoever replied first.
Winning Proposals Close 2.5 Days After the First Open
The average time from first open to closed-won was 2.5 days (Proposify, 2026). Deals that drag far beyond that window are usually stuck on a question, a missing stakeholder or a pricing objection.
Time to Close Varies by Industry
Some industries sign almost immediately. Telecommunications proposals closed in 0.98 days on average, hotel and venue in 1.05 days and legal services in 1.20 days (Proposify, 2026). Others take longer: wholesale distribution averaged 14.91 days, event management 12.16 days and installation 9.0 days.
Proposals Sent Within 24 Hours of a Demo Close 35% Faster
Optifai’s 2026 Pipeline Study, based on CRM timestamps from 939 B2B SaaS companies, found that deals with a proposal sent within 24 hours of the demo closed 35% faster. The same study measured the gap between demo and proposal at one to three days for small deals and 15 to 30 days for enterprise deals.
That gap is pure waiting time. Closing it is the cheapest speed gain in the entire sales cycle.
Want a branded first draft before the buyer has left the call? Start free and generate your first proposal from your website URL and a single prompt.
Proposal Length and Structure
Longer is not better. The data on length and layout is some of the most consistent in the study.
Winning Proposals Average 11 Pages
Winning proposals averaged 11 pages, while losing proposals averaged 13 (Proposify, 2026). Winning proposals also averaged seven sections.
Two extra pages rarely add two extra reasons to buy. More often, they bury the reason that matters. If a section does not help a stakeholder say yes, cut it.
83% of Winning Proposals Include Images
83% of winning proposals included images, with an average of 12 per proposal (Proposify, 2026). Visuals break up dense text and help buyers who skim, which, with a dozen readers per deal, is most of them.
Proposals With a Watched Video Are 3.3 Times More Likely to Close
Only 20% of proposals included video (Proposify, 2026). When a buyer watched the video, the proposal was 3.3 times more likely to close. This is a correlation: buyers who are already interested are more likely to press play. Even so, a short personal video gives a forwarded proposal the human context it otherwise loses.
For more on why layout and visuals change outcomes, see our breakdown of proposal reading psychology.
How Buyers Read Proposals
How buyers read proposals has changed because the number of readers has changed. These figures show what engaged reading looks like.
Buyers Viewed 93% of the Proposals They Signed
Buyers viewed 93% of the proposals they went on to sign, and 80% of the proposals they rejected (Proposify, 2026). Being opened is not the same as being read, so open rates alone tell you little.
Winning Proposals Are Viewed 12 Times
Winning proposals were viewed 12 times on average, against eight times for losing proposals (Proposify, 2026). Total viewing time was 25.3 minutes for winners and 15.8 minutes for losers, roughly 60% more time spent on proposals that closed.
Repeat views usually mean the proposal is being passed around a buying group. That is a good sign, and a cue to ask who else needs answers.
More Than One Viewer Lifts the Close Rate by 20%
When more than one stakeholder viewed a proposal, the close rate rose by 20% (Proposify, 2026). Independent research explains why. Forrester’s 2026 research found that the typical buying decision includes 13 internal stakeholders and nine external influencers. Gartner found that buying groups that reach consensus are 2.5 times more likely to report a high-quality deal.
A proposal that only your champion reads is a proposal that has not been approved yet.
Write for the Group, Not the Individual
Gartner’s research found that content tailored to the buying group’s shared goals improved consensus by 20%, while content tailored to individual members had a 59% negative impact on consensus. Personalise to the organisation’s problem, then give each function a short section it can find quickly.
Knowing who opened the proposal and how far they scrolled shows you how buyers read proposals in practice, and whether yours has reached the wider group. Our guide to tracking proposal engagement explains how to read those signals without guessing.
Pricing Statistics From Signed Proposals
The pricing section gets more attention than any other part of the proposal. These numbers show how to present it.
Buyers Spend 7.72 Minutes on Pricing
The average buyer spent 7.72 minutes on the pricing or investment section (Proposify, 2026). That is close to a third of the total reading time on a winning proposal. Clear line items, a stated scope and an obvious total make those minutes productive rather than painful.
Interactive Pricing Doubles Win Rates in the Benchmark Data
Companies using interactive pricing, where buyers select options or quantities themselves, won twice as many proposals and were 21% more likely to close (Proposify, 2026). Giving buyers a choice between options shifts the question from “whether” to “which”.
Recurring Fees Lift Deal Value 18 Times
Proposals that included recurring fees showed an 18-fold lift in deal value (Proposify, 2026). Packaging ongoing support, retainers or maintenance alongside the one-off fee makes the relationship bigger from day one.
Proposals With Discounts Carry 75% Higher Average Value
Proposals that included a discount averaged $35,000 in value, against $20,000 for those without, a 75% difference (Proposify, 2026). Discounts tend to appear on larger deals, so this is not a reason to discount more. It is a reason to show any discount clearly as a line item rather than hiding it in a lower total.
Procurement is a decision-maker in 53% of business buying cycles, according to Forrester. A transparent pricing table gives them less to challenge. A ready-made price quote template for sales is a quick way to standardise that table across your team.
Revisions and Signing Statistics
The final stretch is where deals are won or quietly lost. These numbers show what speeds it up.
Revisions Raise Close Rates
A revision is a buying signal. Close rates rose by 18% after one round of revisions, 28% after two rounds and 45% after three (Proposify, 2026). A buyer who asks for changes is investing in the deal. Turning revisions around the same day keeps that investment alive.
E-Signatures Lift Close Rates by 15%
Proposals that included e-signatures had a 15% higher close rate and closed 60% faster than proposals without them (Proposify, 2026). Removing the print, sign and scan step removes days from the end of the deal.
Proposals Signed by the Seller First Close 25% Faster
Proposals signed by the seller before sending showed a 65% increase in close rate and closed 25% faster (Proposify, 2026). A pre-signed proposal signals that the terms are final and ready, so the buyer’s signature is the only step left.
With built-in e-signatures, your client signs inside the same link they have been reading. The signed status and signing date are recorded, and both parties receive a confirmation email.
Ready to cut the days between “looks good” and “signed”? Try e-signatures inside your next proposal on the free plan.
What These Sales Proposal Statistics Do Not Tell You
Sales proposal benchmarks are valuable, but they have limits worth knowing before you rebuild your process around them.
Most of these figures are correlations from one platform’s users. Proposals with videos close more often, but interested buyers are also more likely to watch videos. Discounted proposals are larger, but larger deals attract discounts. Read each number as a pattern to test, not a law.
The data also reflects teams that already use dedicated software, which skews towards more organised sales processes. If your team still builds proposals in a word processor and sends PDFs, your baseline sits closer to the 20% industry average than the 34% platform average.
Finally, none of these numbers replace qualification. A perfect 11-page proposal sent to the wrong buyer still loses. Our breakdown of the hidden cost of bad business proposals shows what those wasted proposals cost a team over a year.
How to Apply the Data to Your Next Proposal
Turn these sales proposal benchmarks into a short checklist your team uses on every deal:
- Qualify before you write. Confirm the problem, budget and decision-makers first.
- Send within 24 hours of the demo or discovery call.
- Keep it to around 11 pages and seven sections.
- Lead with a shared summary the whole buying group agrees with.
- Present pricing as clear line items, with options where they make sense.
- Include recurring services alongside one-off work.
- Make signing possible inside the document itself.
- Watch opens and scroll depth, then follow up with a specific answer, not a generic check-in.
A sales proposal template built around this structure gives every rep the same strong starting point.
For consulting and agency teams, a professional business proposal template follows the same length and section discipline.
The Final Word on Sales Proposal Statistics
The sales proposal statistics are clear on the basics. Winning proposals are shorter, faster and easier to share. They are read by more than one person, viewed more than once and signed inside the document rather than printed. Pricing is transparent, revisions are welcomed and the whole thing goes out while the buyer still remembers the call.
None of that requires a bigger team. It requires a process where the draft exists the same day, the buying group can open it from one link and the signature sits at the end of it. Proposal.biz handles the draft, the link, the document analytics and engagement tracking and the signature in one window.
Frequently Asked Questions
What is the average sales proposal close rate?
Benchmark data from more than 740,000 proposals puts the industry average close rate at 20%. Teams using a dedicated proposal platform averaged 34%, and some industries, such as non-profit and telecommunications, closed above 50%. Your own industry is the most useful comparison.
How long should a sales proposal be?
Winning proposals averaged 11 pages and seven sections in Proposify’s 2026 benchmark, while losing proposals averaged 13 pages. Shorter proposals are easier for a buying group to share and approve, so cut anything that does not help a stakeholder say yes.
How quickly do buyers open and sign proposals?
Buyers opened proposals 34 minutes after they were sent on average, and winning proposals closed 2.5 days after the first open. Sending within 24 hours of a demo was linked to a 35% faster close in separate pipeline research.
Do e-signatures improve proposal close rates?
Proposals with e-signatures had a 15% higher close rate and closed 60% faster in Proposify’s benchmark data. Letting the buyer sign inside the proposal removes the print, sign and scan step at the point where deals most often stall.
Which sales proposal statistics matter most for small teams?
For small teams, the most useful sales proposal statistics are speed to send, proposal length and qualification rate. Sending within a day, keeping proposals near 11 pages and only writing for qualified buyers improve results without adding headcount.