
Free tool for sales leaders

Sales Velocity Calculator

Find out how much revenue your pipeline produces every day, then see which of the four levers would grow it fastest. Type straight into the formula below.

Your pipeline, as a formula
%
$
days
$0
of pipeline revenue per day
Per 30 days$0
Per quarter$0
Which lever moves you fastest

Impact of a 10% improvement on each lever, holding the others steady.

Hit a revenue target

Enter a 30 day target. See what each lever would need to become on its own.

    See your lever breakdown and target plan

    Enter your work email to unlock both insights.

    Templates That Help Deals Close Faster

    The sales velocity calculator shows the problem. These templates help fix it. Velocity drops when documents are slow to send. Start from a ready template and get the proposal, quote or contract out the same day.

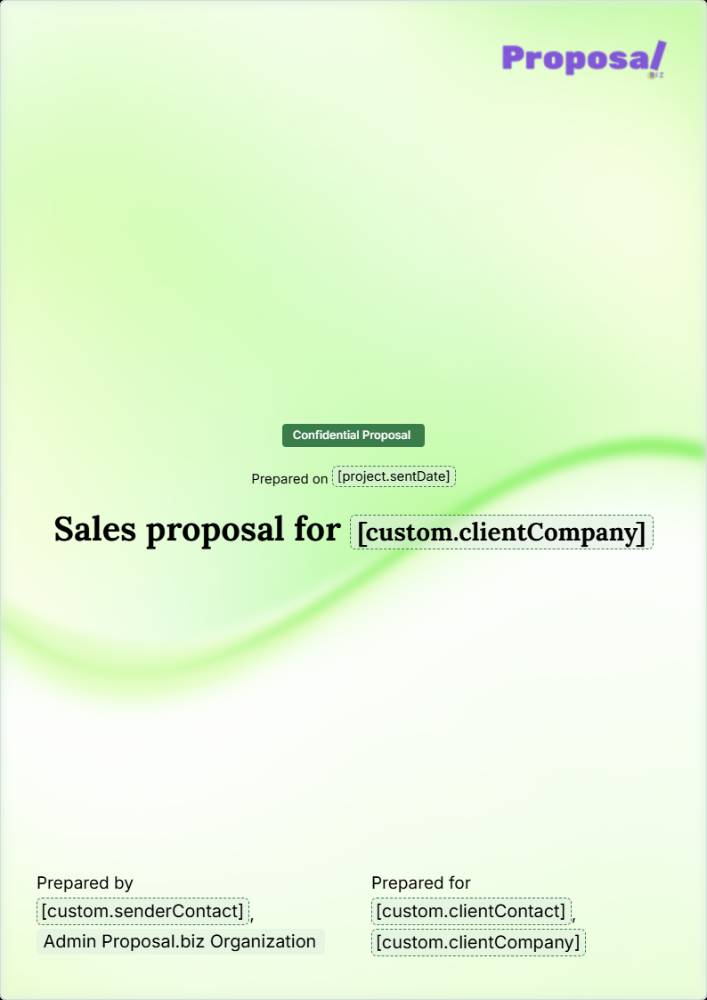
    Sales Proposal Template template preview
    Proposal

    Sales Proposal Template

    A complete proposal with the problem, your solution, pricing and next steps. Send it straight after the discovery call.

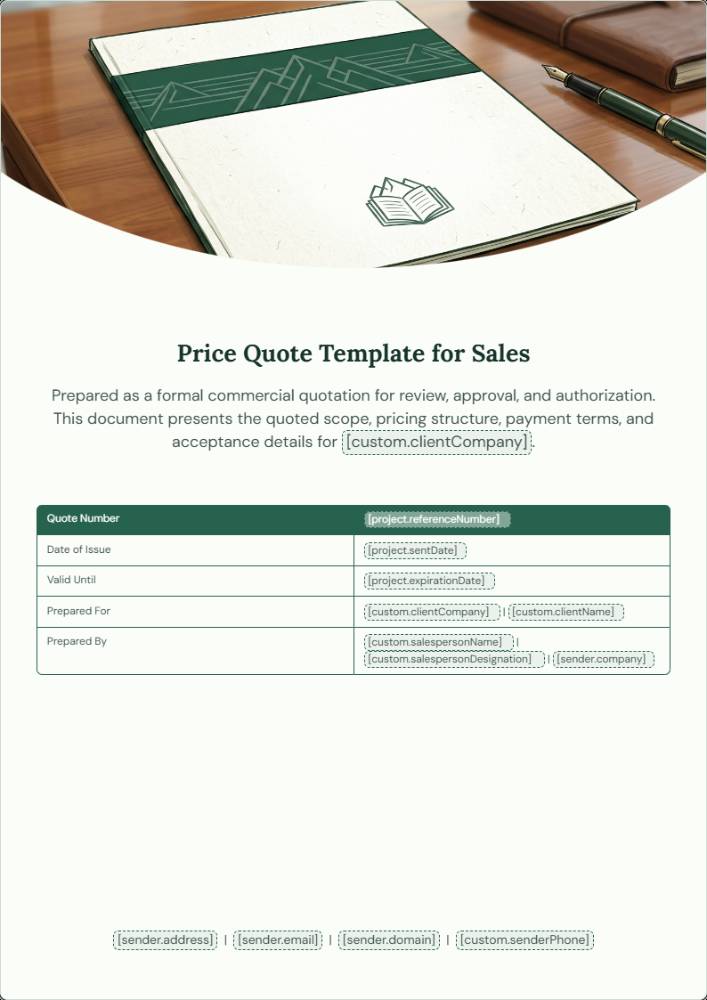
    Price Quote Template for Sales template preview
    Quote

    Price Quote Template for Sales

    A clear, itemised quote for buyers who are ready to talk numbers and do not need a full proposal.

    B2B Sales Contract Agreement template preview
    Contract

    B2B Sales Contract Agreement

    Turn a yes into a signed agreement quickly, with terms, payment schedule and signature blocks in place.

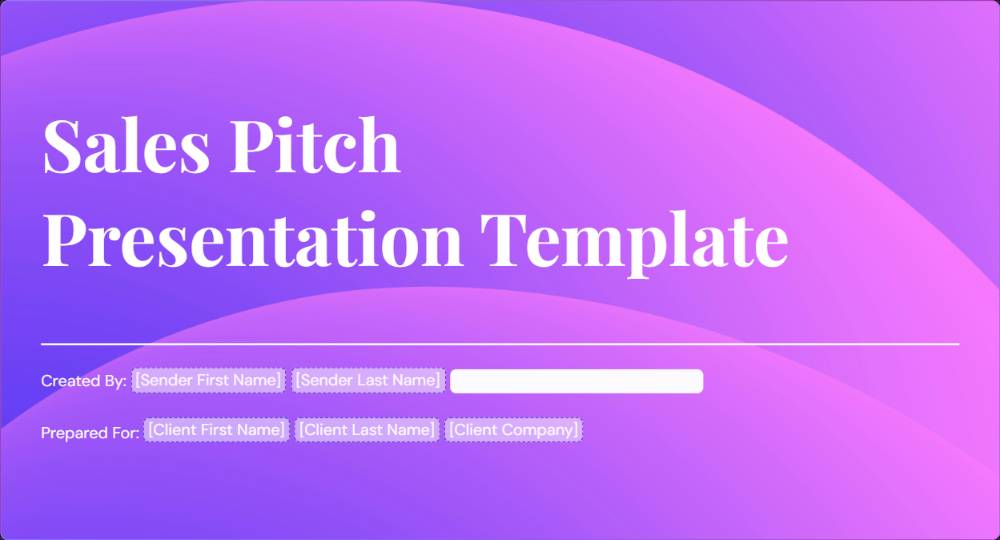
    Sales Pitch Presentation template preview
    Presentation

    Sales Pitch Presentation

    A short, structured pitch for first meetings, so more early conversations become real opportunities.

    What Is Sales Velocity?

    Sales velocity is how much revenue your pipeline produces each day. The sales velocity formula is open opportunities × win rate × average deal value ÷ sales cycle length. It combines four numbers you already track: open opportunities, win rate, average deal value and sales cycle length.

    Pipeline value tells you how much is in play. Sales velocity tells you how fast money is actually arriving, and which of the four levers is holding it back.

    How to Use the Sales Velocity Calculator

    Three steps and about a minute.

    1

    Pull four numbers

    Take them from your CRM for the same period and the same type of deal.

    2

    Type them into the formula

    Use the boxes or the sliders. Your daily, monthly and quarterly velocity update instantly.

    3

    Find your best lever

    Unlock the lever breakdown to see which change would grow revenue fastest, and what it takes to hit your target.

    How to Calculate Sales Velocity: The Four Inputs

    Most wrong answers come from measuring one of these the wrong way.

    1. Open opportunitiesQualified deals currently in play with a real path to close. Leave out stale deals nobody is working.
    2. Win rateWon deals divided by won plus lost deals. Not won deals divided by every lead.
    3. Average deal valueThe average value of closed won deals after discounts. Not the value of your pipeline.
    4. Sales cycle lengthDays from opportunity created to deal closed. Use the median if a few deals ran very long.

    A Sales Velocity Example

    A team has 40 opportunities, a 25% win rate, $12,000 average deals and a 60 day cycle. That gives $2,000 of revenue a day, or about $60,000 every 30 days.

    Improve each lever by 10% and the result is almost the same for the first three. Cycle length wins, because it is the divisor. Halve your cycle and velocity doubles.

    Which Lever to Pull First

    On paper the levers are worth about the same. In practice, some are far cheaper to move.

    Slower to move

    More opportunities

    Usually needs more marketing spend or more reps, and takes a quarter or more to show up.

    Slower to move

    Bigger deals

    Means repackaging or repositioning your offer, which takes time to test.

    Sales controls it

    Higher win rate

    Shaped by qualification and by what happens after the buyer says "send me something".

    Sales controls it

    Shorter cycle

    Mostly waiting time between steps, which your team can remove this month. That is why sales teams start here.

    How to Shorten the Sales Cycle

    Cycles are rarely long because buyers are slow. They are long because of waiting between steps.

    1

    Send the proposal the same day

    Momentum fades between a good call and the proposal arriving. A ready library of services, pricing and proof makes same-day realistic.

    2

    Let clients sign in the document

    Printing, scanning and emailing a separate contract adds days. Let the client sign where they read.

    3

    Book the next step on every call

    Deals without a dated next step drift. More ideas in these strategies to shorten the B2B sales cycle.

    How to Raise Your Win Rate

    Fewer, better opportunities with a higher win rate often beat a bloated pipeline.

    Qualify before you write

    Every proposal sent to a buyer with no budget or authority lowers your win rate and takes time from deals that can close.

    Follow up when they read it

    A follow-up sent when a buyer opens your proposal lands very differently. Learn how to track proposal engagement.

    Match proof to the buyer

    Use the case study and pricing closest to the buyer's industry. Specific proposals beat generic ones.

    Common Sales Velocity Mistakes

    Five habits that make the number feel wrong.

    Mistake
    Fix
    Mixing small and enterprise deals
    Calculate velocity for each segment
    Counting dead deals as open
    Close out stale deals first
    Win rate from all leads
    Divide won by won plus lost
    Pipeline value as deal size
    Average closed won deals only
    One long deal skewing the cycle
    Use the median cycle length

    Long buying committees change every input. See how the enterprise sales cycle behaves differently.

    Faster Documents, Faster Revenue

    Once the sales velocity calculator shows where time is lost, look at your documents. Many lost cycle days go on getting a polished document to the client and getting it signed. That is the stage Proposal.biz fixes.

    • Branded proposals from one promptPaste your website URL once. Proposal.biz learns your brand, services and pricing, then drafts every document from a short prompt.
    • Know when they read itDocument analytics show when a proposal is opened and how far the client scrolled.
    • Signed and paid in one linkClients sign and pay in the same place. One tool to create and send proposals.
    Send proposals faster, free

    Frequently Asked Questions

    Everything you need to know about the sales velocity calculator

    Sales velocity equals open opportunities, multiplied by win rate, multiplied by average deal value, divided by sales cycle length in days. The result is revenue per day.
    There is no universal benchmark, because it depends on deal size, market and sales motion. Compare your own figure over time and by segment. Rising is good, whatever the number.
    Monthly suits most B2B teams, with a deeper review each quarter. High-volume teams often track it weekly.
    Cycle length is the divisor. Cutting it by 10% raises velocity by about 11.1%, and halving it doubles velocity.
    Use the mean when deal lengths are similar. Switch to the median when a few very long deals pull the average up.
    It gives a useful directional forecast. Multiply daily velocity by the days left in the period, and treat it as a guide, since new and lost deals change the inputs.
    Yes. The core calculation needs no sign-up. Your email unlocks the lever breakdown and the target planner.

    Speed Up Every Deal in Your Pipeline

    Run the sales velocity calculator each month, then tighten qualification, send proposals faster and follow up when buyers are reading.

    Try Proposal.biz for free Free forever - No credit card.
    Book a Demo